U.S. School Bus Crash Statistics
Every day, school buses transport more than 20 million students to and from school. Although riding a school bus is generally safer than walking or traveling by car, the potential for serious accidents still exists. To further understand the risks of riding in a school bus, Brumley Law Firm reviewed and summarized 10 years of publicly available NHTSA data to help inform the public about school bus safety trends.
Table of Contents
- Key Findings
- Are School Buses Safe?
- How Many School Bus Crash Fatalities Are There Per Year?
- How Many People Have Been Injured in School Bus Crashes?
- Where Are Fatal School Bus Crashes Occurring?
- Who Is Most Likely To Die in a School Bus Crash?
- What Time of Day Do Most Fatal School Bus Accidents Occur?
- The Worst School Bus Crashes in History
- School Bus Laws and Safety Tips
Key Findings
- There were 976 fatal school bus accidents between 2013 and 2022.
- 1,082 people died and 132,000 people were injured in school bus accidents between 2013 and 2022.
- Approximately 108 people are killed and 13,200 people are injured in school bus accidents each year.
- Texas, Florida, and Georgia have the highest number of school bus crashes and fatalities.
- Occupants of other vehicles are most likely to die in a school bus accident.
- Of the 111 school bus occupants who died, 61 were passengers and 50 were bus drivers.
- Only nine states have school bus seat belt laws and twenty-five have stop-arm camera laws.
Are School Buses Safe?
While this analysis highlights the numerous school bus crashes that have occurred over the past 10 years, it is important to acknowledge that school buses remain one of the safest modes of transportation for students. In fact, of the 343,391 fatal motor vehicle crashes that occurred between 2013 and 2022, only 0.28% involved school buses. This low accident rate is largely due to stringent regulations and safety features on school buses, such as the iconic yellow color, rollover protection, and flashing stop-arms, all designed to minimize the risk of injury and fatality.
How Many School Bus Crash Fatalities Are There Per Year?
Every year, approximately 108 people are killed in school bus crashes, and between 2013 and 2022, there were 1,082 deaths. However, over these ten years, there was a gradual, positive decline in overall school bus deaths, which can be attributed to technological advancements and improved safety measures taken by school districts and states. In 2013, the highest number of school bus fatalities was recorded, with a total of 131 deaths.
![Total School Bus Fatalities [2013-2022]](https://brumleylawfirm.com/wp-content/uploads/2024/08/Total-School-Bus-Fatalities-2013-2022.png)
An outlier in the dataset is 2020, which saw nearly half the number of deaths compared to other years. This significant decrease can be attributed to the COVID-19 pandemic, which caused many schools to transition to remote learning, thereby reducing the number of school buses in operation.
How Many People Have Been Injured in School Bus Crashes?
Between 2013 and 2022, school bus crashes resulted in approximately 132,000 injuries. The year with the highest number of injuries was 2013, which saw approximately 24,000. On average, there were 13,200 injuries per year during this period. As noted earlier, the significantly lower number of injuries in 2020 can be attributed to the COVID-19 pandemic and the shift to remote schooling. If you were involved in a school bus accident and are considering legal options, you may want to consult with an accident attorney in Seattle to better understand your rights.
![Total School Bus Injuries [2013-2022]](https://brumleylawfirm.com/wp-content/uploads/2024/08/Total-School-Bus-Injuries-2013-2022.png)
The total number of injuries per year reflects an estimated number.
Which States Had the Most Fatal School Bus Crashes?
The map below shows a breakdown of where fatal school bus crashes occurred between 2013 and 2022. Hover over each state to see more information regarding the total number of fatal crashes and deaths.
Of all the fatal school bus crashes that occurred between 2013 and 2022, Texas had the highest number, with 75 crashes and 87 fatalities. Florida followed closely behind with 74 crashes and 76 fatalities. The table below shows the total number of school bus crashes and fatalities, by state, over the 10-year period.
| Fatal School Bus Crashes By State [2013-2022] | ||
| State | Number of Crashes | Number of Fatalities |
| Texas | 75 | 87 |
| Florida | 74 | 76 |
| Georgia | 60 | 65 |
| New York | 59 | 59 |
| Pennsylvania | 53 | 59 |
| North Carolina | 47 | 52 |
| California | 37 | 39 |
| Illinois | 30 | 34 |
| New Jersey | 29 | 32 |
| Indiana | 29 | 33 |
| Virginia | 26 | 28 |
| Wisconsin | 26 | 29 |
| South Carolina | 24 | 26 |
| Arizona | 23 | 24 |
| Louisiana | 23 | 28 |
| Tennessee | 23 | 31 |
| Ohio | 22 | 25 |
| Michigan | 22 | 26 |
| Mississippi | 22 | 26 |
| Missouri | 22 | 26 |
| Kentucky | 21 | 21 |
| Alabama | 20 | 20 |
| Maryland | 17 | 22 |
| Iowa | 15 | 18 |
| Minnesota | 14 | 14 |
| Massachusetts | 13 | 14 |
| Connecticut | 13 | 15 |
| Colorado | 12 | 12 |
| Washington | 12 | 12 |
| Arkansas | 11 | 15 |
| Nevada | 10 | 10 |
| Maine | 9 | 10 |
| Oklahoma | 9 | 15 |
| West Virginia | 8 | 8 |
| Utah | 8 | 9 |
| Nebraska | 7 | 7 |
| Montana | 7 | 9 |
| Delaware | 6 | 6 |
| Oregon | 6 | 6 |
| Kansas | 5 | 5 |
| Wyoming | 5 | 5 |
| North Dakota | 5 | 6 |
| Idaho | 3 | 3 |
| New Mexico | 3 | 3 |
| South Dakota | 3 | 4 |
| Hawaii | 2 | 2 |
| New Hampshire | 2 | 2 |
| Vermont | 2 | 2 |
Which Counties Had the Most Fatal School Bus Crashes?
The two U.S. counties that had the most fatal school bus crashes from 2013-2022 were Harris County, Texas, and Kings County, New York, with eleven each. Three other counties – Cook County, Illinois; Los Angeles County, California; and Maricopa County, Arizona – had nine crashes each. All of these counties are regarded as being some of the most populous in the U.S., which increases the number of vehicles on the road and therefore the rate at which accidents, including school bus accidents, occur.
| Counties With The Most Fatal School Bus Crashes [2013-2022] | |
| County | Number of Crashes |
| Harris County, TX | 11 |
| Kings County, NY | 11 |
| Cook County, IL | 9 |
| Los Angeles County, CA | 9 |
| Maricopa County, AZ | 9 |
What Roads Had The Most Fatal School Bus Crashes?
Between 2013 and 2022, only seven roads across the U.S. experienced more than one fatal school bus crash. Florida is home to two of the roads with the most fatal school bus crashes (US-301 and CR-611), highlighting a heightened concern over the risk of school bus accidents in the state. The table below provides a breakdown of where these school bus crashes most commonly occur.
| Roads With More Than One Fatal School Bus Crash [2013-2022] | ||
| Road | County | State |
| SR-165 | Merced County | California |
| US-301 | Alachua County | Florida |
| CR-611 | Pinellas County | Florida |
| US-61 | East Baton Rouge Parish | Louisiana |
| US-311 | Forsyth County | North Carolina |
| SR-113 UWCHLAN AVE | Chester County | Pennsylvania |
| I-20 | Howard County | Texas |
It is important to know that some of these are interstate roads, meaning they stretch across state lines. Therefore, the table above also specifies the states and counties in which these fatal crashes occurred.
Who Is Most Likely To Die in a School Bus Crash?
In looking at who is most likely to suffer a fatality in a school bus crash, we found that occupants of other vehicles are far more likely to be killed than any other type of person (763 fatalities). Pedestrians are the second most likely to be killed (169 fatalities), followed by school bus occupants, which includes school bus drivers and passengers (111 fatalities). The type of person who is least likely to be injured in a school bus crash includes bicycle, e-bicycle, skateboard, scooter, and wheelchair users (39 fatalities).
| Yearly Fatalities By Type of Person [2013-2022] | ||||
| Year | School Bus Occupants | Pedestrians | Bicycle, E-Bicycle, Skateboard, Scooter, & Wheelchair Users | Occupants of Other Vehicle(s) |
| 2022 | 12 | 13 | 3 | 76 |
| 2021 | 11 | 21 | 2 | 74 |
| 2020 | 3 | 6 | 4 | 41 |
| 2019 | 10 | 15 | 6 | 80 |
| 2018 | 14 | 23 | 2 | 78 |
| 2017 | 12 | 10 | 3 | 72 |
| 2016 | 14 | 20 | 6 | 85 |
| 2015 | 13 | 11 | 4 | 87 |
| 2014 | 11 | 28 | 4 | 77 |
| 2013 | 11 | 22 | 5 | 93 |
The significant number of fatalities among occupants of other vehicles can be attributed to the weight and size disparity between school buses and standard cars. School buses typically weigh between 15,000 to 36,000 pounds, while the average car weighs about 4,000 pounds. Therefore, in the event of a collision between a passenger vehicle and a school bus, the likelihood of severe injury or wrongful death for the car’s occupants is considerably high.
![Fatalities By Type of Person [2013-2022]](https://brumleylawfirm.com/wp-content/uploads/2024/08/Fatalities-By-Type-of-Person-2013-2022-1.png)
Are School Bus Drivers or Passengers More Likely To Die in a School Bus Crash?
Of the 111 school bus occupants who were killed between 2013-2022, 61 were passengers (55%) and 50 were bus drivers (45%). Although more school bus passengers were killed, it is important to consider that there is typically only one bus driver per school bus.
![Bus Driver Vs. Passenger Fatalities [2013-2022]](https://brumleylawfirm.com/wp-content/uploads/2024/08/Bus-Driver-Vs.-Passenger-Fatalities-2013-2022.png)
How Old Were the School Bus Occupants Who Died?
Among all school bus occupants who were killed in accidents from 2013-2022, one was under 5 years old (0.90%), 15 were between 5 and 10 years old (14%), six were between 11 and 13 years old (5%), 13 were between 14 and 18 years old (12%), and 76 were 19 years old and older (69%). It can be assumed that the majority of school bus occupant victims were 19 years of age or older due to the great proportion of victims who were bus drivers (45%). In most states, individuals must be at least 18 years of age to operate a school bus legally.
![School Bus Occupant Fatalities Vs. Age Group [2013-2022]](https://brumleylawfirm.com/wp-content/uploads/2024/08/School-Bus-Occupant-Fatalities-Vs.-Age-Group-2013-2022-2.png)
What Time of Day Are School Bus Fatalities Most Likely to Occur?
School bus fatalities are most likely to occur during the early morning and mid-afternoon hours. This comes as no surprise as these are the peak times at which students are transported to and from school. According to the data, the specific hours in which most school-aged fatalities occur are between 3–3:59 p.m. (26%) and 7–7:59 a.m. (19%).
![School-Age Fatalities Vs. Time of Day [2013-2022]](https://brumleylawfirm.com/wp-content/uploads/2024/08/School-Age-Fatalities-Vs.-Time-of-Day-2013-2022.png)
The Most Deadly School Bus Crashes in History
Here’s a look at some of the worst school bus crashes in the U.S. to date.
Yuba City Bus Disaster
Date: May 21, 1976
Location: Martinez, California
Number of Fatalities: 29
A school bus was transporting 52 passengers from Yuba City High School to Miramonte High School for a choir event when the bus driver, who was unfamiliar with the bus, mistook a low brake air pressure warning for a low engine oil pressure warning. As the bus driver intended to exit the freeway to address what he assumed was an oil pressure issue, the air compressor drive belt for the brakes failed due to the lack of air pressure. As a result, the bus flipped off of an elevated off-ramp (I-680), landing on its roof and killing 29 passengers, 28 of whom were students. The remaining 24 passengers, including the bus driver, survived with minor to severe injuries.
Carrollton Bus Crash
Date: May 14, 1988
Location: Carroll County, Kentucky
Number of Fatalities: 27
A former school bus was transporting a church youth group of 66 passengers home after a day spent at Kings Island amusement park in Ohio when it was struck head-on by a pickup truck that was traveling on the wrong side of Interstate 71. The impact of the accident caused the school bus’ fuel tank to rupture, leaving the bus in flames and killing 27 people, including the bus driver. The pickup truck driver was later determined to have been impaired by alcohol at the time of the accident. The Carrollton bus accident is considered to be the deadliest drunk-driving accident in U.S. history.
Prestonburg School Bus Crash
Date: February 28, 1958
Location: Prestonburg, Kentucky
Number of Fatalities: 27
A Floyd County school bus was transporting 48 students to school on U.S. Route 23 when it rear-ended a wrecker truck. The impact caused the bus to veer off the road and plunge into the Big Sandy River. Only 22 children were able to escape the school bus before it became fully submerged in the water. The remaining 26 individuals, including the bus driver, drowned before they could be rescued. This crash is also regarded as the “Big Sandy Bus Crash.”
Alton Bus Crash
Date: September 21, 1989
Location: Alton, Texas
Number of Fatalities: 21
A school bus was transporting students to Mission High School and Alton Memorial Junior High School when it was struck by a Dr. Pepper delivery truck that blew through a stop sign. This caused the school bus to plunge into a water-filled caliche pit, where it quickly sank. As a result, 21 students died, with many other students sustaining minor to severe injuries. Both the school bus driver and the delivery truck driver survived.
Snow Hill School Bus Crash
Date: May 31, 1985
Location: Snow Hill, North Carolina
Number of Fatalities: 7
A southbound school bus was transporting 26 students from Snow Hill Primary School and West Greene Middle School on U.S. 13 when it collided with a northbound Military Distributors of Viginia, Inc. tractor-trailer carrying pickles. This initial collision caused the tractor-trailer to crash into another tractor-trailer carrying shelled corn, which was then struck by a passenger vehicle. This four-vehicle collision resulted in seven deaths, including six students. The driver of the Military Distributors tractor-trailer also died in the crash and was later reported to have suffered from either an epileptic seizure or extreme fatigue at the time of the accident.
Chattanooga Bus Crash
Date: November 21, 2016
Location: Chattanooga, Tennessee
Number of Fatalities: 6
A school bus was transporting 37 students home from Woodmore Elementary School when the bus driver lost control of the bus on a narrow, windy road, causing it to strike a pole, flip over, and crash into a tree. It was reported that six students died and 32 others, including the bus driver, survived with minor to severe injuries. The bus driver, who was later found guilty of six counts of homicide, was reported to have been speeding and on his phone at the time of the accident.
School Bus Seat Belt Laws
Wearing your seat belt while riding on a school bus, or any type of motor vehicle, is one of the most important things that you can do to ensure your safety. Federal law mandates that school buses under 10,000 pounds have lap and shoulder belts for all seats, while those over 10,000 pounds are only required to have seat belts for the driver. Surprisingly, only nine states in the U.S. have laws requiring seat belts to be installed on school buses. Unfortunately, just because the seat belts are installed does not mean that they are being used. Additionally, some states allow for local jurisdictions and school districts to decide whether they enforce the usage of seat belts on school buses. The table below shows a breakdown of the various seat belt laws in each state.
| States With Seat Belt Laws | |
| States | Law |
| Arkansas | All school buses purchased or leased on or after January 1, 2018, must have seat belts. However, this law only applies if the seat belts are funded by the state. If they are not funded by the state, local school districts may decide whether to install seat belts and enforce their use. |
| California | All school buses in California manufactured on or after July 1, 2004, as well as all school buses manufactured on or after July 1, 2005, that carry more than 16 passengers, must have three-point seat belts. All school buses in California must have seat belts by 2035. |
| Florida | All school buses purchased after December 31, 2000, must have seat belts and they must be worn. The state and school district will not be held liable for injuries that occurred if the student was not wearing a seat belt. |
| Iowa | Three-point belts are required to be installed on all new school buses as of October 2, 2019. |
| Louisiana | As of 1999, school buses in Louisiana are required to have “occupant restraint systems.” However, this law only applies if the seat belts are funded by the state. If they are not funded by the state, local school districts may decide whether to install seat belts and enforce their use. |
| Nevada | All school buses manufactured on or after July 1, 2019, must have three-point seat belts installed. |
| New Jersey | All school buses must have three-point seat belts. Local school districts can decide whether they would like to have three-point seat belts. |
| New York | All school buses manufactured after July 1, 1987, must have seat belts. However, local school districts can decide whether seat belt usage is enforced. |
| Texas | All school buses purchased after 2017 are required to have three-point seat belts. However, this law only applies if the seat belts are funded by the state. If they are not funded by the state, local school districts may decide whether to install seat belts and enforce their use. |
School Bus Stop-Arm Camera Laws
A major safety concern with school buses is illegal passing. When a school bus is stopped, oftentimes other drivers become impatient and choose to proceed anyway, creating a significant risk for students entering and exiting the bus. Stop-arm cameras are an additional safety feature that can be added to school buses to help protect students who are entering and exiting them. These cameras are mounted on the exterior of the school bus and capture footage of drivers who illegally pass a school bus with their stop arm extended. Those found to be illegally passing a school bus whose stop arm is out and activated may be subject to fines. Currently, only 25 states have enacted school bus stop-arm camera laws.
| States With Stop-Arm Camera Laws |
| Alabama |
| Arkansas |
| Connecticut |
| Delaware |
| Florida |
| Georgia |
| Idaho |
| Illinois |
| Indiana |
| Maine |
| Maryland |
| Michigan |
| Mississippi |
| New York |
| North Carolina |
| Oklahoma |
| Pennsylvania |
| Rhode Island |
| South Carolina |
| Tennessee |
| Utah |
| Virginia |
| Washington |
| West Virginia |
| Wyoming |
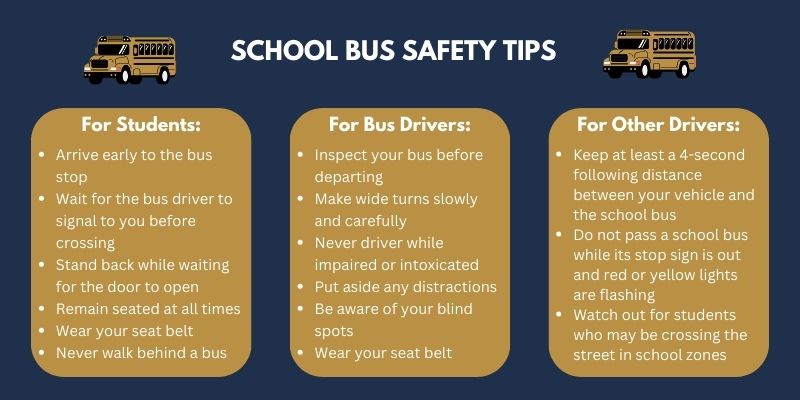
School Bus Safety Tips
To support public awareness, we’ve compiled general safety tips based on national transportation safety sources and recommendations.
Methodology
This study was conducted using data from the National Highway Traffic Safety Administration (NHTSA) and their Fatality Analysis Reporting System (FARS).
In the context of this study, a school bus includes school bus body types and non-school bus body types functioning as school buses. Additionally, this data excludes any crashes in which a fatality did not occur, crashes that were unreported, and crashes in which comprehensive information could not be gathered.